Decision support tools are critical for the development of risk-sensitive plans and the accurate estimation of costs. One way to equip our customers with decision-support capability is through simulation and machine learning.
In this way, we enable them to answer what-if questions almost immediately. We create the option to deploy predictive analytics in their real-time analytical portals. This post uses clinical trial enrollment planning as the use case. It outlines the steps of accelerating what-if analysis by using simulation-generated data and machine learning for real-time enrollment prediction.
Designing clinical trial enrollment plans
Enrollment plans are developed by pharmaceutical companies and clinical research organizations for every clinical trial. The goal is to enroll a target number of patients as quickly and cost-effectively as possible. Thus, a key performance indicator (KPI) is the number of patients enrolled in the clinical trial within a pre-specified number of months.
Often, however, a significant portion of clinical trials fails to meet the planned targets within the expected time horizon. Accurately estimating the project time is not straightforward because the enrollment process consists of a long sequence of dynamic events. Factors to consider include how long it takes to reach target patient enrollment. The total cost of initiating clinical research efforts in new countries, activating clinical research sites, and screening and enrolling patients in clinical trials also need to be considered.
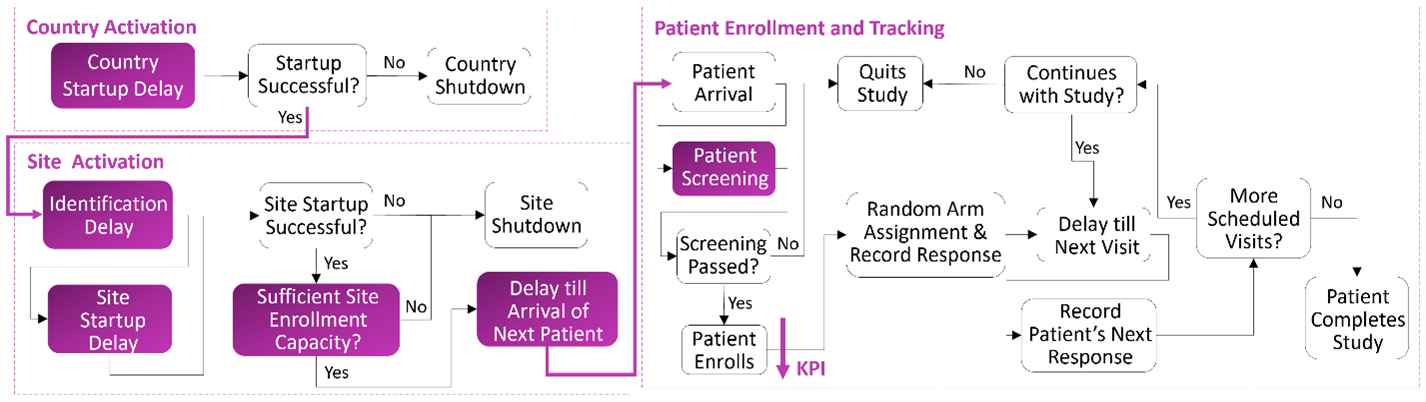
Figure 1 presents a high-level view of the clinical trial enrollment process. It also highlights the events associated with country and site activations and patient screening. The exposure of these events to high levels of uncertainty complicates the enrollment design. It becomes more likely to experience budget shortfalls and delays in getting the drug to the market. Therefore, it is important for clinical research organizations and pharmaceutical companies to have access to decision-support tools. These tools help them design risk-sensitive enrollment plans with more information about what the future might hold.
One such tool available for our customers is the SAS Clinical Enrollment Simulation Cloud. At the foundation of this model lies a scalable and data-driven discrete-event stochastic simulation of the clinical trial enrollment process. It models dynamic clinical trial enrollment operations as a discrete sequence of country and site activations and patient screening and enrollment. These events occur at specific points in time and trigger changes in the state of the system. The temporal analysis of the simulated states informs the stakeholders how the clinical trial designed today might perform in the future.
The goal of this post is to investigate how stochastic simulation and its integrated use with machine learning can answer what-if questions in real time. First, we describe the use of simulation-generated data for predicting how many patients would be enrolled in the clinical trial within a year. And how much risk there is in the prediction. Then, we discuss how this data set can be further used to answer what-if questions in real time. Out of all the possibilities, we arbitrarily select the following two what-if questions:
- If the enrollment capacity were 200 patients at each site and the patient screening probability were 20%, what would patient enrollment be 13.5 months after the trial starts?
- If the site enrollment capacities were reduced by 10%, how many patients would be enrolled 19.5 months after the start of the trial?
We develop the capability to quickly answer these questions in two steps. First, we fit a machine learning model to a large simulation-generated data set. Then, we evaluate the model for the specific input parameter values indicated by the what-if questions in (1) and (2). Because these questions will be answered instantaneously, the what-if analysis will have been accelerated by machine learning to answer potentially many similar questions.
Using simulation for KPI generation and risk quantification
We view stochastic simulation as composed of two main parts: system logic and inputs. For a clinical trial enrollment simulation, the process flow in Figure 1 plays the role of the system logic. The simulation inputs include country startup delay, site identification delay, site startup delay, site enrollment capacity, site enrollment rate, and patient screening failure probability. Although the clinical trial inputs also include arm allocation, reaction and termination probabilities, and patients’ visit schedules, the focus of this post is on country and site entities and their attributes. However, this does not mean that there are only six different input random variables in this use case. Because they are defined per country and per site, the total number of input random variables is, in fact, 51 for a clinical trial designed for one country and ten sites.
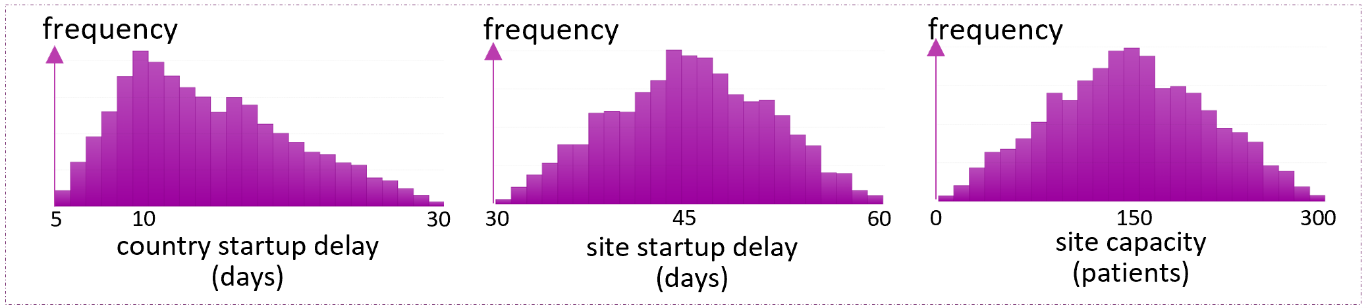
Information and/or historical data about these inputs lead to the construction of probabilistic models representing the uncertainty in the simulation inputs. Figure 2 illustrates example probabilistic models for country startup delay, site activation delay, and site capacity. Specifically, Figure 2 assumes the country start up delay to change between 5 and 30 days, but most likely 10 days. Hence, it is characterized by the triangular distribution whose parameter vector [minimum, mode, maximum] is given by [5, 10, 30]. Similarly, the distribution of the time it takes to activate a site is characterized as triangular with 30, 45, and 60 as the distribution parameters. Finally, the rightmost plot illustrates the assumption that each site will most likely enroll 150 patients and always between 0 and 300 patients.
Any stochastic simulation is designed to run for multiple replications. Each replication represents a different version of the future. By sampling from the probabilistic input models illustrated in Figure 2 and applying the logic shown in Figure 1 for a sufficiently large number of replications, the simulation generates output data about when and the circumstances under which patients might be enrolled in the clinical trial in different realizations of the future. It is for this reason that simulation is, in fact, a large-data generation program representing what the future holds.
Another feature of simulation is that it even generates data for a system that does not exist yet. And this is exactly the case for clinical trial enrollment. We use simulation to generate data about how different enrollment plans designed today might perform in the future. In this way, we position our customers to choose the best enrollment plan with the help of the information they gain from the analysis of the simulation-generated output data.
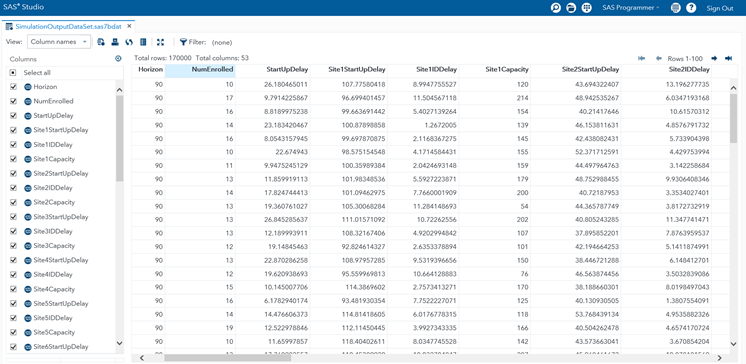
Figure 3 presents a snapshot of a simulation-generated data set with 170,000 rows and 53 columns in SAS® Studio. This rectangular data set has been generated from a 1-country and 10-site enrollment simulation replicated for 5,000 iterations. Each for a specific duration of months. The Horizon column indicates the value of this duration in days. The NumEnrolled column shows the number of patients enrolled in the clinical trial during the horizon in the corresponding simulation replication. It is important to notice that the values of NumEnrolled show variation across the rows because each row represents a different simulation replication of the experiment performed.
There are 53 columns because the first two columns indicate the simulation horizon and the KPI while the remaining 51 columns contain realizations of the 51 input random variables sampled from their probability distribution functions in each replication. Next, we statistically analyze this 170,000-row and 53-column rectangular data set and illustrate the outcome of our risk analysis in Figure 4 using SAS® Visual Analytics.
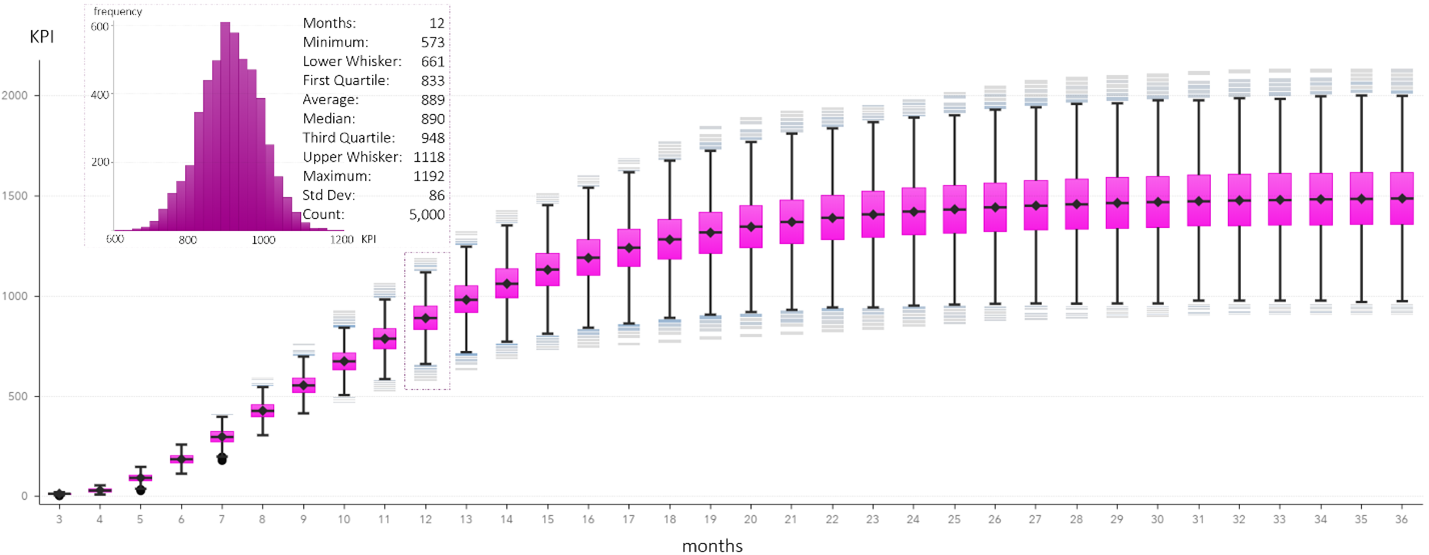
The X and Y axes of Figure 4 correspond to the Horizon and NumEnrolled columns of Figure 3. The risk in the patient enrollment is illustrated with a box-and-whiskers plot for each value of the simulation horizon taking values between 3 and 36 months.
Figure 4 also highlights the box-and-whiskers plot that answers how many patients would be enrolled within a year. The plot also answers how much risk there is in this prediction. We expect 889 patients to enroll in the clinical trial within the next 12 months. We expect this prediction to fall between 887 patients (i.e., 889 – 1.96*86/√5000) and 892 patients (i.e., 889 + 1.96*86/√5000) with a 95% probability. However, there is a 25% chance that the enrollment will fall below 833 patients (first quartile). There is also a 25% chance that the enrollment will exceed 948 patients (third quartile). Still, there is a 50% chance that the patient enrollment will fall between 833 and 948.
Using machine learning for accelerating the what-if analysis
We are now ready to answer our what-if questions. We first wonder whether the results displayed in Figure 4 already contain the answers for the selected what-if questions. Assume that the simulation has not been run for those specific combinations of site capacities, patient screen failure probability, and simulation duration. However, we answer the what-if questions without running any new simulation experiments. Instead, using the 170,000-row and 53-column data set, we search for a machine learning model that provides a good approximation to the KPI of interest. SAS Visual Data Mining and Machine Learning identifies this model as a neural network after dividing the 170,000-row simulation output data set into training, validation, and test data sets (80% training, 10% validation, 10% test).
Also, we use SAS Visual Data Mining and Machine Learning through the SWAT package. It is a Python interface to SAS® Cloud Analytic Services (CAS). Figure 5 illustrates the steps of real-time prediction described here. It refers you to Time Travel into the Future of Clinical Trial Enrollment Design for the complete code.

Testing exhibits a mean square error of 951.03 and an R-square of 99.47%. The entire process of loading the simulation output data, training a neural network, and testing the trained model in the cloud takes a total of 3 minutes and 2.86 seconds. By using the resulting machine learning model of the patient enrollment, we answer the what-if questions as follows: If the enrollment capacity were 200 patients at each site and the patient screening failure probability were 20%, then the clinical trial would enroll 1,102 patients in the first 13.5 months and 1,676 patients in the first 19.5 months. However, if the site enrollment capacities were reduced by 10%, then the number of enrolled patients would be 1,593 at the end of 19.5 months.
Notice that each of these neural network predictions is a point estimate without any quantification of risk. This issue can be addressed by performing a Monte Carlo simulation of the neural network fit to propagate any specified level of input variation through the patient enrollment process.
Predicting the KPIs in real time
A natural question to ask here is why we answer the what-if questions without using the simulation model directly. It is because we have already obtained a good approximation of the simulation output response. There might be many other what-if questions that we have to answer. If we had attempted to answer the what-if question in (a) with simulation by estimating the mean patient enrollment within ± 1 patient, then we would have to perform at least 1,000 replications. As a result, we would obtain 1,117 patients as the mean enrollment and compute the RMSE in the neural fit approximation as 14.75. Furthermore, each simulation replication would take 7.62 seconds.
Thus, the attractiveness of integrating simulation with machine learning here is that the neural fit delivers its prediction in 0.0289 seconds, conducting a nearly instantaneous calculation. This would enable you to quickly explore the implications of potentially many scenarios in real time, accelerating the what-if analysis. Therefore, the solution that is built on the integration of simulation and machine learning might be better suited to the need to make patient enrollment predictions in real time. Furthermore, you are now able to deploy the enrollment simulation in a real-time analytical portal. You have just created an opportunity to turn this solution into a widely used analytics for enrollment planning.
What-If analysis with machine learning summary
This post builds on the view that stochastic simulations are large-data generation programs for highly complex and dynamic stochastic systems. Their integration with machine learning leads to real-time KPI predictions and creates an opportunity for deployment in real-time analytical portals. We demonstrate how this can be done by using SAS Visual Data Mining and Machine Learning through SWAT within the context of clinical trial enrollment design. However, this demonstration can be readily extended for dynamic and stochastic systems in various areas including health care, life sciences, manufacturing, and supply chains.